
Market Update: August 2022
Published
September 9, 2022
Category
Market Insights
Reading Time
7 MINS
by Vision Wealth Partners
Markets Drop on Late-Month Sell-Off
August was a challenging month for markets, with a late slide bringing all three major indices into the red for the month. The S&P 500 lost 4.08 percent, the Dow Jones Industrial Average (DJIA) dropped 3.72 percent, and the Nasdaq Composite fell 4.53 percent. The sell-off was due to rising interest rates in August, caused in part by comments from Federal Reserve (Fed) Chairman Jerome Powell, who said the central bank planned to keep short-term rates higher for longer to combat inflation. Rising interest rates hurt stock valuations and can lead to slower economic growth.
The negative returns came despite improving fundamentals. The blended earnings growth rate for the S&P 500 in the second quarter was 7.8 percent, according to Bloomberg Intelligence, beating analyst estimates at the start of earnings season for a more modest 4.1 percent increase and signaling continued improvement for U.S. businesses during the quarter. These better-than-expected results are a good sign for markets because fundamentals drive long-term performance.
We can’t say the same for technical factors. All three indices ended the month well below their 200-day moving averages, though the DJIA briefly broke above trend mid-month. This marks five consecutive months with all three indices ending the month below trend, which is a cause for concern. The 200-day moving average is an important technical indicator because prolonged breaks above or below trend can signal changing investor sentiment.
Concerns about tighter global monetary policy weighed on developed market investors. The MSCI EAFE Index dropped 4.75 percent, while the MSCI Emerging Markets Index eked out a 0.46 percent gain. Technical factors were challenging; both indices ended the month below their 200-day moving averages and have finished below trend every month this year.
Fixed income markets also experienced sell-offs due to rising interest rates. The 10-year Treasury yield increased from 2.6 percent at the start of the month to 3.15 percent at month-end. Short-term rates also increased notably; the 2-year Treasury yield climbed from 2.9 percent to 3.45 percent at month-end. The Bloomberg U.S. Aggregate Bond Index lost 2.83 percent.
High-yield fixed income also struggled, with the Bloomberg U.S. Corporate High Yield Index losing 2.3 percent. High-yield credit spreads were up slightly but remained well below highs from early July.
Fed Pumps Brakes on the Economy
August showed that the Fed has started to make progress in combating inflation. July consumer and producer inflation reports showed slowing inflation on a monthly and year-over-year basis, and the central bank’s preferred inflation metric—personal consumption expenditures—declined modestly in July and came in below expectations year-over-year. Although inflation remains too high, signs of a peak were welcome.
Powell nonetheless reiterated late last month that, as long as inflation is above its target range, the Fed plans to keep monetary policy tighter until it sees sustained progress in reducing inflationary pressure, even as the economy slows. This is important because it signals that rate hikes are likely to continue, even in the face of a slowing economy.
As higher interest rates have started to bite, the economy does indeed appear to be slowing. Business and consumer spending dipped in July, and durable goods orders were flat. Retail sales and personal spending growth also slowed and came in below economist expectations in July.
Housing has seen the largest slowdown in activity this year; rising mortgage rates have cooled the sector. The average 30-year mortgage rate increased from 3.3 percent at the start of the year to 5.95 percent at the end of August, weighing on prospective home buyers’ ability to finance purchases. As you can see in Figure 1, the pace of existing home sales has slowed notably this year, from a peak of less than 6.5 million in January to roughly 4.8 million in July.
Figure 1. Existing Home Sales, 2011–Present
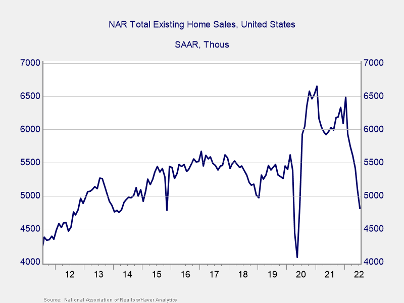
Although home prices haven’t shown a similar level of decline, we made progress in slowing year-over-year price growth in June. Given the importance of housing costs on consumer inflation, housing demand and prices will remain closely monitored.
Despite the slowdown, it’s important to note that the economy remains in a relatively good place. July’s employment report showed that more than 500,000 jobs were added during the month, more than double economist expectations and an encouraging sign that fundamentals remain healthy despite headwinds created by tighter Fed policy.
Faster growth could be ahead. Both major measures of consumer confidence showed notable signs of improvement in August, which could bolster future consumer spending and support economic growth. Business confidence also remained in expansionary territory in July, which should support continued hiring. Although we’re likely to see a slower growth economy for the rest of the year, slower growth is still growth, and the momentum from earlier in the year should help us avoid a recession in the near future.
Markets May Face More Turbulence as Uncertainty Remains
Although the economy remains resilient, markets remain susceptible to several risks. Most notably, the impact from the Fed’s attempts to combat inflation through tighter monetary policy will continue. Markets and economists have largely expected higher rates throughout the year, but the August sell-off after Powell’s comments is a reminder that even moderate surprises can lead to notable short-term volatility.
Looking ahead, it’s likely the Fed will continue to raise rates throughout this year and the start of next, but the pace and path of future rate hikes remains unknown and data dependent. While the hawkish surprise in August frightened markets, the expectation for higher rates in the short term is now priced in. It’s possible we’ll see positive surprises in the months ahead regarding inflation, which could lead to lower rates than markets expect. The same potential exists for economic expectations, with slower growth and even a recession now priced in.
The path forward remains cloudy, and more volatility is likely. With most of the potential bad news priced in, however, upside opportunities remain. Given the potential for more market turbulence in the short term, the best strategy for most investors is to have a well-diversified portfolio that matches goals with timelines. As always, if you have questions, contact your financial advisor to discuss your financial plan.
All information according to Bloomberg, unless stated otherwise.
Disclosure: Certain sections of this commentary contain forward-looking statements based on our reasonable expectations, estimates, projections, and assumptions. Forward-looking statements are not guarantees of future performance and involve certain risks and uncertainties, which are difficult to predict. Past performance is not indicative of future results. Diversification does not assure a profit or protect against loss in declining markets. All indices are unmanaged and investors cannot invest directly into an index. The Dow Jones Industrial Average is a price-weighted average of 30 actively traded blue-chip stocks. The S&P 500 Index is a broad-based measurement of changes in stock market conditions based on the average performance of 500 widely held common stocks. The Nasdaq Composite Index measures the performance of all issues listed in the Nasdaq Stock Market, except for rights, warrants, units, and convertible debentures. The MSCI EAFE Index is a float-adjusted market capitalization index designed to measure developed market equity performance, excluding the U.S. and Canada. The MSCI Emerging Markets Index is a market capitalization-weighted index composed of companies representative of the market structure of 26 emerging market countries in Europe, Latin America, and the Pacific Basin. It excludes closed markets and those shares in otherwise free markets that are not purchasable by foreigners. The Bloomberg Aggregate Bond Index is an unmanaged market value-weighted index representing securities that are SEC-registered, taxable, and dollar-denominated. It covers the U.S. investment-grade fixed-rate bond market, with index components for a combination of the Bloomberg government and corporate securities, mortgage-backed pass-through securities, and asset-backed securities. The Bloomberg U.S. Corporate High Yield Index covers the USD-denominated, non-investment-grade, fixed-rate, taxable corporate bond market. Securities are classified as high-yield if the middle rating of Moody’s, Fitch, and S&P is Ba1/BB+/BB+ or below. One basis point is equal to 1/100th of 1 percent, or 0.01 percent.
###
Vision Wealth Partners is located at 9881 Broken Land Parkway, Suite 220, Columbia, MD 21046, and can be reached at 410.910.9740. Securities and advisory services offered through Commonwealth Financial Network®, Member FINRA/SIPC, a Registered Investment Adviser.
Authored by Brad McMillan, CFA®, CAIA, MAI, managing principal, chief investment officer, and Sam Millette, manager, fixed income, at Commonwealth Financial Network®.
© 2022 Commonwealth Financial Network®