
Market Update: December 2022
Published
January 13, 2023
Category
Market Insights
Reading Time
9 MINS
by Vision Wealth Partners
December Sell-Off Caps Turbulent Year
Markets sold off in December, with the negative month contributing to mixed results for the quarter and declines for 2022. The S&P 500 lost 5.76 percent during the month, which held the index to a 7.56 percent gain for the quarter. Despite the fourth-quarter rebound, the S&P 500 lost 18.11 percent over the course of the year. The Dow Jones Industrial Average (DJIA) was similar, with a 4.09 percent decline in December holding the index to a 16.01 percent gain for the quarter. The DJIA still lost 6.86 percent for the year. Finally, the Nasdaq Composite lost 8.67 percent in December, which led to a 0.79 percent decline for the quarter. The technology-heavy index lost 32.54 percent throughout the year as rising rates and slowing growth weighed on investors.
Negative results for the month and year came despite better-than-expected earnings growth. Per Bloomberg Intelligence, as of December 30, 2022, with 99 percent of companies having reported actual earnings, the blended earnings growth rate for the S&P 500 in the third quarter was 4.6 percent, up from estimates at the start of earnings season for a 2.6 percent increase. This solid outcome follows better-than-expected earnings growth in both the first and second quarters of 2022 and shows that businesses continued to successfully operate despite economic headwinds. Ultimately, fundamentals drive long-term market performance, so continual earnings growth was a positive development that bodes well for markets as we head into the new year.
While fundamental factors were supportive to end the year, the same cannot be said for technical factors. The S&P 500 ended the year below its 200-day moving average, as the year-end sell-off brought the index below trend after a brief stint above trend at the end of November and start of December. The DJIA finished December above trend, marking three consecutive months with technical support for the index; however, the Nasdaq Composite ended the month below trend. The 200-day moving average is a widely followed technical indicator as prolonged breaks above or below trend can signal shifting investor sentiment for an index. The mixed technical indicators at the end of 2022 indicate uncertainty for equity investors to start 2023.
International markets were mixed in December, but results were similar to the U.S. on a quarterly and annual basis. The MSCI EAFE Index gained 0.08 percent in December, capping off a 17.34 percent return for the quarter. Despite the positive end to the quarter, developed international equities ended the year down 14.45 percent. The MSCI Emerging Markets Index lost 1.35 percent during the month and gained 9.79 percent for the quarter. Emerging market stocks lost 19.74 percent for the year. Slowing global growth and high levels of global inflation were headwinds for international equity investors.
Technicals were mixed for international markets to end the year. The MSCI EAFE Index finished the month above its 200-day moving average, which marked two consecutive months finishing above trend. The MSCI Emerging Markets Index, on the other hand, ended December below trend, marking 18 consecutive months with the index finishing below its 200-day moving average.
Fixed income markets also experienced declines in December and for the year, largely driven by rising interest rates. The 10-year U.S. Treasury yield rose from 1.63 percent at the start of the year to 3.88 percent by year-end. Short-term yields saw even larger increases as the 1-year U.S. Treasury yield surged from 0.4 percent at the start of 2022 to 4.73 percent at year-end. The rise in yields was primarily due to higher rates from the Federal Reserve (Fed) as the central bank hiked the federal funds rate 4.25 percent in 2022 to combat inflation. These higher rates caused sell-offs for fixed income investors.
The Bloomberg U.S. Aggregate Bond Index dropped 0.45 percent during the month but managed to notch a 1.87 percent gain for the quarter. This was not enough to offset losses from earlier in the year as the index lost 13.01 percent in 2022. The Bloomberg U.S. Corporate High Yield Bond Index saw a similar 0.62 percent decline for the month, a 4.17 percent gain for the quarter, and an 11.19 percent decline for the year. High-yield credit spreads widened notably last year, increasing from 3.05 percent at the start of 2022 to 4.81 percent at year-end. Wider credit spreads indicate that investors became more cautious throughout the course of the year.
Economic Updates Remain Positive
Despite market turmoil, economic data releases showed continued economic growth to close out 2022. The labor market saw signs of surprising strength toward the end of the year, as the November employment report revealed 263,000 jobs added against calls for 200,000. The unemployment rate ended November at 3.7 percent, which was down from the start of the year, in a sign that jobs were still plentiful near year-end. This is an encouraging sign that economic fundamentals remained healthy toward year-end as a strong labor market has historically supported consumer and business spending.
Consumer and business spending had encouraging signs of strength toward year-end. Personal income and spending both rose in November, which marked four straight months with spending growth. Consumer spending growth was relatively consistent last year—supported by Covid-19 pandemic-era savings and a strong labor market—which was impressive given economic headwinds as well as declining confidence.
Core durable goods orders, which are viewed as a proxy for business investment, rose in November following a solid jump in October. This indicates that businesses continued to spend and invest to meet high levels of demand toward year-end. Additionally, both consumer and service sector confidence showed improvements toward the end of the year, which should help support future spending growth.
Housing Continues to Slow
Not all economic news for 2022 was positive as the housing sector showed signs of continued slowdown at year-end. After serving as a bright spot in the post-lockdown economic expansion in 2020 and 2021, the housing sector slowed notably in 2022 due to low supply of homes for sale, high prices, and rising mortgage rates dramatically affecting the pace of home sales. As you can see in Figure 1, the pace of existing home sales fell in November to its lowest level since the lockdown-induced nadir in May 2020.
Figure 1. Existing Home Sales, Seasonally Adjusted Annualized Rate, 2017–Present
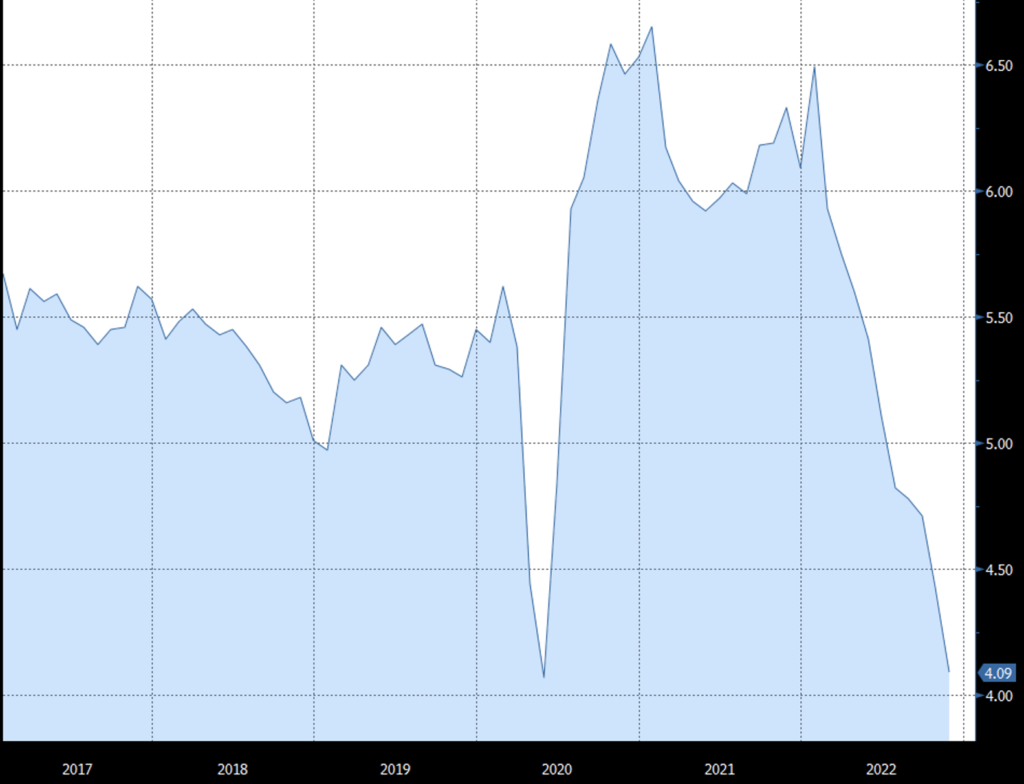
Source: National Association of Realtors/Bloomberg
Looking forward, we’ll likely need to see a drop in prices and mortgage rates before housing sales recover to pre-pandemic levels. The average 30-year mortgage started 2022 at 3.3 percent and hit a high of 7.35 percent in early November before ending the year at 6.66 percent. While there were signs at year-end that housing price growth has started to fall—and in some cases even turn over—the housing sector is expected to experience ongoing, short-term slowing growth as high rates and prices serve as a headwind for prospective home buyers.
Inflation Slowing but Risks Remain
A major market and economic risk last year was a high level of inflation. The Fed responded by hiking rates and tightening monetary policy throughout 2022 to combat rising prices, which caused sell-offs across equity and fixed income markets. We’ve seen positive signs that the worst of inflation is likely behind us, although inflation stayed high on a year-over-year basis to start the new year.
The Fed has made it clear that it sees inflation as a major economic and market risk, and it’s expected to keep monetary policy tight to continue to fight inflationary pressure. While markets continue to price in slighter higher short-term yields in the first half of this year, expectations call for looser policy toward year-end. This could lead to additional market volatility if these expectations aren’t met, so the Fed and inflation bear monitoring in 2023.
There are other risks to watch out for as well as we start the new year. Here at home, political risks are set to take center stage as last year’s midterm elections led to a split federal government. While political risks can change quickly, it’s likely we’ll be reading about debt ceiling debates and a potential government shutdown at some point this year.
Looking abroad, the main risks to start the new year are the ongoing Russia-Ukraine war and the slow reopening of China as the country eases Covid-19 restrictions. The impact of the war in Ukraine on markets largely declined toward the end of 2022, although the continued conflict could lead to further instability and uncertainty. China’s reopening efforts are widely viewed as a positive development for the global economy following months of Covid-driven lockdowns. Going forward, the country could be a source of additional uncertainty if medical risks rise and an important area to monitor in 2023.
Additional risks may also be out there that we don’t expect at this time. While many risks that impacted markets in 2022 have shown signs of diminishing, risks that hit investors in 2023 can and will change throughout the year and further short-term volatility is quite possible.
Ultimately, we enter 2023 with a relatively positive backdrop. While risks remain, economic fundamentals are solid, and market valuations are generally more attractive now than they were at the start of 2022. Given the potential for further short-term uncertainty, a well-diversified portfolio that matches investor goals with timelines is the best path forward for most. As always, if you have questions or concerns, you should reach out to your financial advisor to discuss your financial plans.
All information according to Bloomberg, unless stated otherwise.
Disclosure: Certain sections of this commentary contain forward-looking statements based on our reasonable expectations, estimates, projections, and assumptions. Forward-looking statements are not guarantees of future performance and involve certain risks and uncertainties, which are difficult to predict. Past performance is not indicative of future results. Diversification does not assure a profit or protect against loss in declining markets. All indices are unmanaged and investors cannot invest directly into an index. The Dow Jones Industrial Average is a price-weighted average of 30 actively traded blue-chip stocks. The S&P 500 Index is a broad-based measurement of changes in stock market conditions based on the average performance of 500 widely held common stocks. The Nasdaq Composite Index measures the performance of all issues listed in the Nasdaq Stock Market, except for rights, warrants, units, and convertible debentures. The MSCI EAFE Index is a float-adjusted market capitalization index designed to measure developed market equity performance, excluding the U.S. and Canada. The MSCI Emerging Markets Index is a market capitalization-weighted index composed of companies representative of the market structure of 26 emerging market countries in Europe, Latin America, and the Pacific Basin. It excludes closed markets and those shares in otherwise free markets that are not purchasable by foreigners. The Bloomberg Aggregate Bond Index is an unmanaged market value-weighted index representing securities that are SEC-registered, taxable, and dollar-denominated. It covers the U.S. investment-grade fixed-rate bond market, with index components for a combination of the Bloomberg government and corporate securities, mortgage-backed pass-through securities, and asset-backed securities. The Bloomberg U.S. Corporate High Yield Index covers the USD-denominated, non-investment-grade, fixed-rate, taxable corporate bond market. Securities are classified as high-yield if the middle rating of Moody’s, Fitch, and S&P is Ba1/BB+/BB+ or below.
###
Vision Wealth Partners is located at 9881 Broken Land Parkway, Suite 220, Columbia, MD 21046, and can be reached at 410.910.9740. Securities and advisory services offered through Commonwealth Financial Network®, Member FINRA/SIPC, a Registered Investment Adviser.
Authored by Brad McMillan, CFA®, CAIA, MAI, managing principal, chief investment officer, and Sam Millette, manager, fixed income, at Commonwealth Financial Network®.
© 2023 Commonwealth Financial Network®